Unsupervised Classification
In this lesson we will learn how to do Unsupervised classification in R. We will use a sub-set of Sentinel-2 multi-spectral images covering the North Campus of the University at Buffalo (UB), New York. We will use the unsuperClass() function of the RSToolbox package to run unsupervised classification with 5 classes. Here clustering is done using kmeans which aims to partition n observations into k clusters in which each observation belongs to the cluster with the nearest mean, serving as a prototype of the cluster.
Load package
library (raster)      # raster data
library(rasterVis)  # raster visualisation
library(sp)         # Spatial data processing
library(rgdal)      # Spatial data processing
library(RStoolbox)  # Image analysis
library(ggplot2)    # ploting
The data could be available for download from here.
# Define data folder
dataFolder<-"D://Dropbox//Spatial Data Analysis and Processing in R//DATA_09//DATA_09//"
Load bands
#s=stack(BLUE, GREEN, RED, NIR,SWIR1,SWIR2)
multi=stack(paste0(dataFolder,".\\Sentinel_2\\multi_bands.tif"))
K-means clusstering for unsupervised classification
k-means clustering is a method of vector quantization, originally from signal processing, that is popular for cluster analysis in data mining. k-means clustering aims to partition n observations into k clusters in which each observation belongs to the cluster with the nearest mean, serving as a prototype of the cluster. This results in a partitioning of the data space into Voronoi cells (Wikipedia).
set.seed(25)
unC_05 <- unsuperClass(multi,   # raster stack
    nSamples = 100,             # Number of random samples to draw to fit cluster map
    nClasses= 5,                    # Number of classes
    nStarts = 5)                    # Number of random starts for kmeans algorithm.
Plot map:
myPalette <- colorRampPalette(c("white","dark grey", "darkgreen","green", "light blue"))
spplot(unC_05$map, main="Unsupervised Classificantion, No.class= 5" ,
      colorkey = list(space="right",tick.number=1,height=1, width=1.5,
              labels = list(at = seq(1,4.8,length=5),cex=1.0,
              lab = c("Class-1" ,"Class-2", "Class-3", "Class-4", "Class-5"))),
              col.regions=myPalette,cut=4)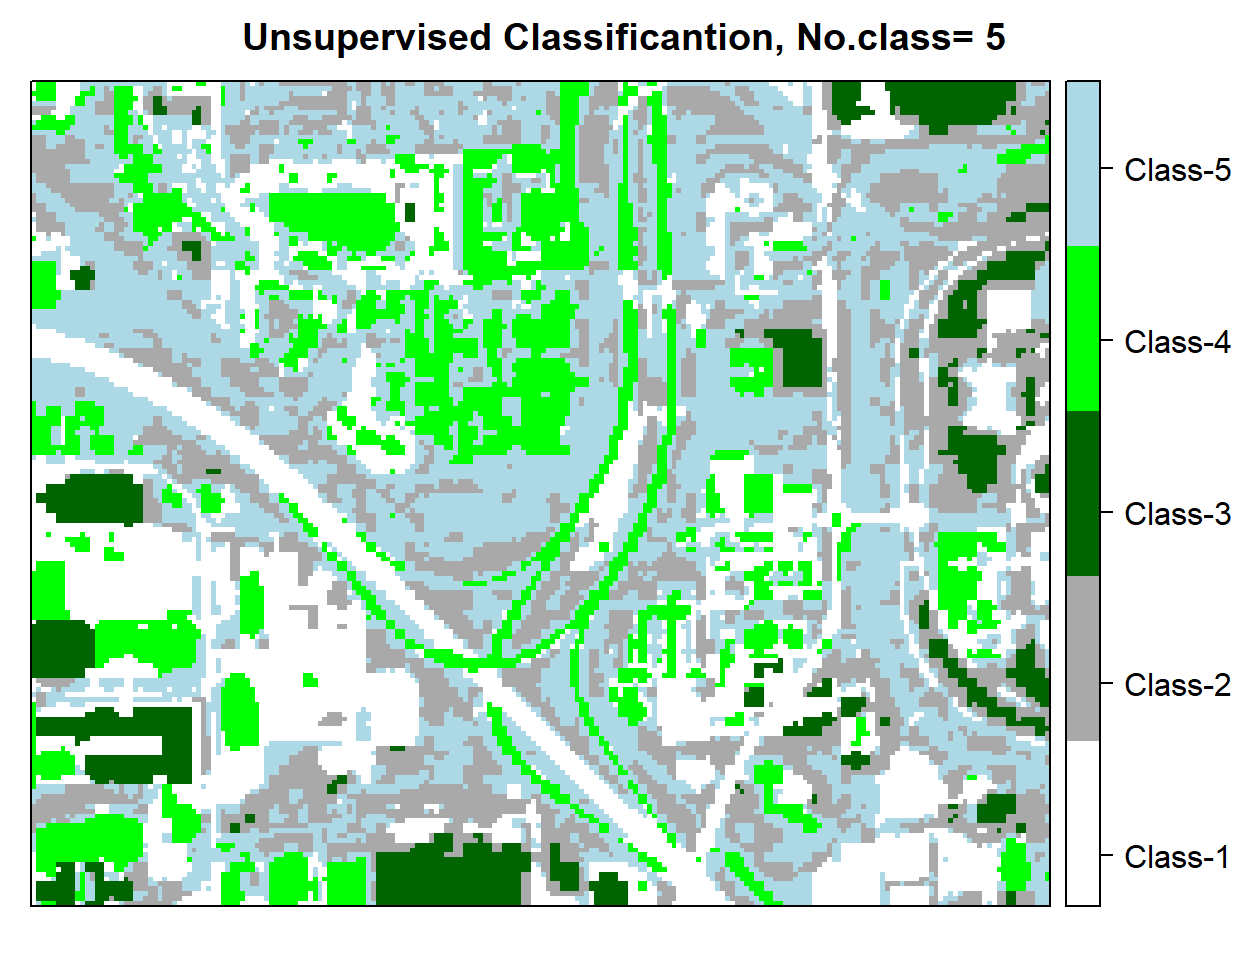
Write raster
# writeRaster(unC_05$map, filename=paste0(dataFolder,".\\Sentinel_2\\K_mean_UnSuper.tif"), format="GTiff", overwrite=TRUE)