4. Double/Debiased Machine Learning
Two powerful methodologies have historically talked past each other:
Machine learning predicts outcomes with remarkable accuracy, but its regularization techniques — shrinking or zeroing out coefficients to prevent overfitting — introduce systematic bias into any coefficient it produces. You can’t use a Lasso regression to estimate a causal effect and trust the result.
Classical econometrics (OLS, IV, etc.) produces unbiased, inferentially valid estimates, but breaks down under high dimensionality. With hundreds or thousands of control variables, standard regression is either infeasible or hopelessly overfit.
Double Machine Learning solves both problems simultaneously. It uses ML’s predictive power to handle high-dimensional confounders, then recovers valid causal inference through a clever two-step residualization procedure.
How it works
The model
DML assumes a partially linear data-generating process:
\[
\begin{align}
Y &= \theta D + g(X) + \varepsilon \\
D &= m(X) + V
\end{align}
\]
where \(Y\) is the outcome, \(D\) is the treatment, \(X\) is a (potentially very large) vector of confounders, and \(\theta\) is the causal effect you want. The functions \(g(X)\) and \(m(X)\) are called nuisance functions — they govern how confounders affect the outcome and treatment, but you don’t care about them directly.
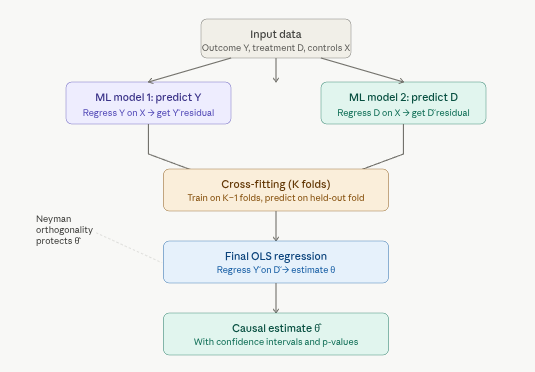
The five-step pipeline
Step 1 — Residualize the outcome. Train any ML model to predict \(Y\) from \(X\). Compute the residual \(\tilde{Y} = Y - \hat{g}(X)\): the part of \(Y\) that confounders cannot explain.
Step 2 — Residualize the treatment. Train a second ML model to predict \(D\) from \(X\). Compute \(\tilde{D} = D - \hat{m}(X)\): the part of \(D\) that confounders cannot explain.
Step 3 — Cross-fit to prevent overfitting. If you train the nuisance models and compute residuals on the same data, the residuals will be artificially small (overfitting). Instead, split the data into \(K\) folds, train on \(K-1\) folds, and predict residuals on the held-out fold. Rotate through all folds and aggregate.
Step 4 — Final OLS. Regress \(\tilde{Y}\) on \(\tilde{D}\): \[\tilde{Y} = \theta\,\tilde{D} + \varepsilon\]
The coefficient \(\hat{\theta}\) is your causal estimate. By construction, you’ve partialled out all confounding variation captured in \(X\).
Step 5 — Inference. Because of the orthogonality property (below), \(\hat{\theta}\) is \(\sqrt{n}\)-consistent and asymptotically normal, giving you valid standard errors, confidence intervals, and p-values.
Why this works: Neyman orthogonality
The critical insight is that the score function used to estimate \(\theta\) is orthogonal to the nuisance parameters. In plain terms: if your ML models for \(g(X)\) and \(m(X)\) are slightly wrong — which they always are — those errors have only a second-order (negligible) impact on \(\hat{\theta}\). This is the “debiasing” step that makes valid inference possible despite using regularized ML.
Supported models and causal structures
PyCausalML is learner-agnostic for the nuisance stages — you can plug in virtually any supervised learning algorithm:
| Penalized linear |
Lasso, Ridge, Elastic Net |
| Tree-based |
Random Forest, gradient boosting, XGBoost |
| Neural networks |
MLPs via scikit-learn |
| Other |
SVM, k-NN |
The notebooks in this chapter use these structural models:
| PLR — Partially Linear Regression |
Standard observational setting; a constant effect |
PartiallyLinearDML |
| Linear / sparse CATE |
The effect varies linearly (or sparsely) with covariates |
LinearDML, SparseLinearDML |
| IRM — Interactive Regression Model |
Binary treatment; doubly robust score for the ATE and a flexible CATE |
InteractiveRegressionDML |
| PLIV — Partially Linear IV |
Endogenous treatment; a valid instrument |
Cross-fitted residual-on-residual IV, plus InstrumentalVariable |
| Nonparametric CATE |
A flexible final stage on the orthogonal pseudo-outcome |
NonParamDML, CausalForestDML, KernelDML |
Advantages
| High dimensionality |
Works when the number of controls \(p \gg n\) |
| Nonlinearity |
Captures complex confounder–outcome relationships OLS cannot |
| Valid inference |
Produces standard errors, CIs, and hypothesis tests |
| Robustness |
Resilient to moderate ML estimation error (orthogonality) |
| Modularity |
Swap learners freely; gradient boosting today, random forests tomorrow |
Limitations
No hidden confounders. Like all observational methods, standard DML (PLR) assumes unconfoundedness: every variable affecting both \(D\) and \(Y\) is in \(X\). An unmeasured confounder still biases \(\hat{\theta}\). The PLIV variant handles endogeneity, but requires valid instruments.
Sample size still matters. DML handles high dimensionality but not small n. The final regression step requires enough observations for asymptotic normality to hold.
Nuisance functions remain black boxes. \(\hat{\theta}\) is interpretable; \(\hat{g}(X)\) and \(\hat{m}(X)\) are not. You learn the effect of treatment but not how each confounder influences the outcome.
Computational cost. Cross-fitting means training \(K\) nuisance models per variable instead of one. Expect runtime roughly \(K\times\) that of a comparable OLS workflow.
Weak instruments. If you use PLIV, DML inherits the weak-instrument problem from classical 2SLS — a weak instrument inflates standard errors and can bias estimates.
Python ecosystem
Primary package: PyCausalML
The estimators in this chapter live in pycausalml.double_machine_learning.
- Partially linear and interactive models:
PartiallyLinearDML, InteractiveRegressionDML
- Heterogeneous effects:
LinearDML, SparseLinearDML, NonParamDML, CausalForestDML, KernelDML
- Cross-fitted first stages for every estimator
- Influence-function standard errors and confidence intervals on the average effect
- SHAP explanations of a fitted CATE through
explain and pycausalml.interpretation
Nuisance learners are scikit-learn models (random forests, gradient boosting, ridge, lasso). Later notebooks also show pipelines, averaged ensembles, and a small hyperparameter grid around the same orthogonal score.
Applications
DML is the natural choice wherever causal questions meet high-dimensional data:
- Economics — price elasticity controlling for thousands of product and market characteristics
- Marketing — true ad-campaign lift after controlling for browsing history and demographics
- Healthcare — drug efficacy controlling for genomic or electronic health record data
- Policy evaluation — job-training program impact controlling for employment history, education, and local conditions
Double Machine Learning is a state-of-the-art method for estimating causal effects when confounders are high-dimensional. It lets you use the predictive power of random forests, gradient boosting, or penalized regression to control for confounders, without giving up the standard errors required to make a causal claim. PyCausalML implements that workflow for partially linear, interactive, instrumental-variable, panel, and clustered designs. Like any observational method, it still relies on the design assumptions of the model you choose.
Resources
Key References
- Chernozhukov, V., Chetverikov, D., Demirer, M., Duflo, E., Hansen, C., Newey, W., & Robins, J. (2018). Double/debiased machine learning for treatment and structural parameters. The Econometrics Journal, 21(1), C1–C68.
- Chernozhukov, V., Hansen, C., & Spindler, M. (2020). DoubleML – Double/debiased machine learning in R and Python. Journal of Statistical Software.
Documentation
- DoubleML user guide — the method, independent of this package
- PyCausalML
double_machine_learning module: PartiallyLinearDML, LinearDML, SparseLinearDML, NonParamDML, CausalForestDML, KernelDML, InteractiveRegressionDML
Back to top